Chart Field Documentation
When you receive a submission (results of a form that users are sending to you when they press the submit form button), data gets stored in encrypted mode, but also becomes aggregated and indexed. Based on the aggregated data, you can later generate charts and place them in your form (they are mainly used for pools, reports, etc).
What type of fields can be displayed in charts?
A chart can display a field that can contain a value. Excluding the Long text field, where the user can input a large amount of text which is not suitable for data aggregation, the fields Short text, Single Choice, Multiple Choice, Dropdown, Date and Time, all of them can be shown in a chart.
What type of charts can I use?
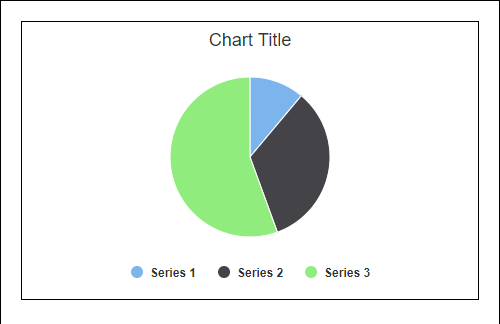
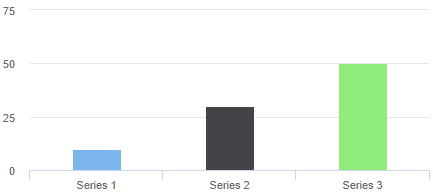
You can use both Pie charts and Column charts.
1. Chart
Use the “Chart” group of properties in order to adjust settings for your chart field.
1.1. Chart title
Sets the title of the chart that will be displayed below the pie or the columns.
1.2. Chart type
Sets the appearance of the chart. Here at Abcsubmit form builder we support at this moment two types of charts:
1.2.1. Pie
1.2.2. Vertical bars (Columns)
1.3. Target field
The field whose submitted form results will be displayed on your chart. Must be another field than the chart itself.